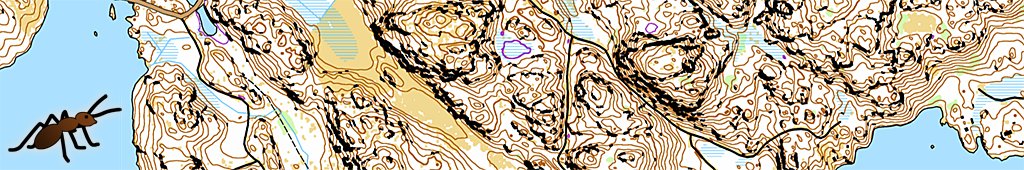
What is MapAnt?
Basically, MapAnt is a gigantic orienteering map covering almost all of Finland. It was automatically generated based on the publically available laser scanning data and topographic maps from the National Land Survey of Finland. It is the most detailed and information-rich map available that is covering the whole country of Finland. Its name, MapAnt, is inspired by the way it was compiled: the about one-hundred computers involved were acting as ants in an anthill, working together in a structured chaos to construct something bigger than they were able to achieve on their own.
How does the map differ from a normal orienteering map?
The map contains almost all types of features present in human-made orienteering maps. Contour lines (2.5 m interval), cliffs, open land, and dense vegetation is extracted from laser scanning data acquired between 2008 and 2016. The vegetation for early scanned areas might have changed quite a bit over the years. Some areas have been scanned during summer, which affects the vegetation mapping and contour quality due to leaves on the trees.
Private land, fields, buildings, roads, paths, railways, lakes, streams, marshes, and so on have been extracted from topographic maps in scale 1:10 000. There are a few orienteering map features that are not present in MapAnt: boulders, fences, pits, small depressions, small marshes, and other small features. Negative contours, i.e. depressions, are shown in purple. To summarize, the quality of a human-made map is still a few levels higher.
Who made it?
MapAnt is based on a joint effort from Jarkko Ryyppö, Joakim Svensk, and Mats Troeng. All of us are passionate orienteers with some kind of obsession for maps and computing. Jarkko has over the last few years built the award-winning Karttapullautin software, which plays a core role in the map generation process. Joakim and Mats got the idea to use Karttapullautin on many computers simultaneously to generate a really large map, and designed, implemented, and fine-tuned the software to achieve it.
How was it possible?
Constructing an auto-generated map with the detail level of MapAnt is a computing-intensive process. In average, it takes the Karttapullautin software about one hour to generate a ten square kilometer map when running on a decent computer. As Finland covers almost 340 000 square kilometers, one needs to wait roughly eight years to get it all done on a single computer. But we were more impatient than that. The solution: parallel computing. With 100 multi-processor computers - acting as the ants of the anthill - we were able to cut down the time to three weeks. In comparison, a human mapper spending 30 hours per square kilometer would map the entire Finland in about 3500 years, if working 8 hours per day...
The steps involved included downloading laser scanning data and topographic map data, dividing the labor on the Karttapullautin processing computers, and creating about four millions of 256x256 pixel tiles at different zoom levels. The combined image size for the highest zoom level is 150 gigapixels, with a resolution of 0.7 pixels per real-world meter. In total, about 10 TB (terabytes) of data were processed. That's pretty much. Trying to put this number into context, printing 10 TB of data as text on paper would require about half a million trees. The pile of A4 papers would be 150 kilometers high when printed on both sides. And the map of Finland would have been more yellow ;)
Why did you make it?
The world would be boring without creativity and inventions, right? Add some open data, and the playground for the digital creator is set. Actually, the crazy idea of creating an orienteering map covering a whole country got us started. Would it be possible at all? How long time would it take? Would the quality of the result be good enough? The greater the challenge, the merrier. That's what drives mankind forward.
Why are there holes in the map?
Some parts of Finland have not been undergoing laser scanning yet. About 20 % of the area, mostly in the northern part of the country, still waits for the laser scanning to be completed. Maybe we will fill the holes when data becomes available.
Why do some parts of the maps seem to be corrupt?
In some places there are distorted contour lines and vegetation, or no contour lines at all. That's due to the usage of some pre-release laser scanning data that has not yet gone through quality assurance at the National Land Survey of Finland. Maybe we will regenerate these areas when data of higher quality becomes available.
How do I use the site, and what features are there?
MapAnt works like any other map website. Zoom in, zoom out, scroll, and dream away. The site works on mobile devices, but there's no doubt that the user experience is better on 28" than on 5".
At the top right there are a few buttons. Click the Feature names button to toggle the visibility of names for features such as villages, hills, marshes, and lakes. This works on zoom level 6 and larger only. Click the Export button to export a part of the map. Just drag a rectangle on the map and select zoom level and file format. You can either create a PNG image for further digital processing or printing, or a KMZ file for e.g. Google Earth. Magnetic north lines can be included at zoom level 7 and larger. They are based on World Magnetic Model for 2010-2015, calculations by Raino Lampinen 2012. This site works best and is tested with Chrome and Firefox.
Here is a bookmarklets to set MapAnt map as a backround map on World Of O Orienteering Maps.
- MapAnt - WorldOfO Maps background map bookmarklet. Go to WOO maps, zoom in to Finland and select this bookmark. You should get MapAnt map as background map.
You can use information from MapAnt freely according to the Creative Commons license. As MapAnt is a free service running on a cheap server, and since we are expecting quite a lot of traffic, you might experience somewhat low performance from time to time. We give no guarantee or assurance whatsoever regarding the uptime, functionality, or data quality of MapAnt. Use it at your own risk.
As a software developer individual, organization or company, you can use the MapAnt tile set in your own applications if you give attribution and link to MapAnt.
WMTS (Web Map Tile Service) and WMS (Web Map Service)
From December 2017 onwards MapAnt.fi map can be accessed via WMTS and WMS. There is currently three alternatives available:
- (1) WMTS, TM35FIN (EPSG:3067) with JHS180 compatible tiles. Here is EPSG:3067 WMTS Capabilities and here is example how to use it in Leaflet.js. This is preferred alternative, it is fastest and has best image quality. Parameter "style=contours" will give contours only whn zoomed in enough. Parameter &dim=0.7 will dim map image (use values 0..1).
- (2) WMTS, Web Mercator (EPSG:3857, EPSG:900913) popularized by web services such as Google and OSM. Here is Web Mercator WMTS Capabilities and here is Leaflet.js example page. Note, transformation to this coordinate system is made on-the-fly so there is compromises in image quality and response times. Parameter "style=contours" will give contours only whn zoomed in enough. Parameter &dim=0.7 will dim map image (use values 0..1).
- (3) WMS, TM35FIN (EPSG:3067) only. Here is WMS URL. Maximum image size is 4000 x 4000 pixels. Image quality is best if requested resolution is a power of 2 (1,2,4,8 ... m/pixel) and image is size below 3000x3000 pixels. Please don't overload WMS service with lots of big requests, we would like to keep this available to provide easy way to access data with clients supporting WMS but not supporting WMTS, such as Ocad
Note, as MapAnt WMTS is a free service running on a cheap server, and since there may be quite a lot of traffic, you might experience somewhat low performance from time to time. We give no guarantee or assurance whatsoever regarding the uptime, response times or data quality. Use it at your own risk.
As a software developer individual, organization or company, you can use the MapAnt imagery in your own applications if you give attribution and link to MapAnt and National Land Survey of Finland
Will my home country be MapAnt'ed in the future?
We don't know. Availability of public geographical data is an essential pre-condition, and that's why we chose Finland. Kudos to its National Land Survey! There is a trend that more and more governments are making their digital geographical data open, and that's great. But so far Finland has been a great proof of concept. It might turn out that we will be happy just with that.